Candlestick Patterns: A Complete Guide to Reading and Trading Chart
A long time ago, trading felt more like guesswork than strategy. Back then, candlestick charts were the tool traders relied on to make sense of it all.
According to historical sources, candlestick charts first appeared in 18th-century Japan, helping merchants track the ups and downs of rice markets. Over time, they became a method for understanding price movements and spotting trends. Japanese candlestick charts made it possible to see patterns in what once looked like random market chaos, and they’re still just as useful today.
If you’re serious about trading smarter, it's essential to learn candlestick patterns and their implications. This article will be your comprehensive guide to candlestick patterns, breaking down how they work and how you can use them in your own trading.
What Is a Candlestick Pattern?
Each candlestick shows the price movement during a specific time, including the opening, closing, high, and low prices.
Candlesticks reveal the struggle between buyers (bulls) and sellers (bears), reflecting market sentiment. They were first developed in Japan during the 18th century by Munehisa Homma, a legendary rice trader. Homma used these patterns to track the emotional dynamics of the market, recognizing that price movements were heavily influenced by trader psychology. He laid the foundation for what we now know as Japanese candlestick patterns, a tool as revolutionary in trading as Fibonacci's golden pocket is today.
Why are Candlestick Patterns Important in Trading?
Candlestick patterns are necessary for understanding market behavior, especially if you’re considering using a modern crypto trading platform.
They help you spot trends and potential reversals, like a "hammer" or "shooting star" showing when a trend might change direction. For instance, patterns such as the flag pattern can help traders identify continuation trends in the market (Don't worry, we'll learn about each of those namings later).
The size and shape of candlesticks also reveal the strength of price movements, showing how much momentum is behind a move.
If you learn them, it'll help you identify the best times to enter or exit trades, improving your timing and controlling risks more effectively.
Overall, using candlestick analysis gives you deeper insight into market dynamics and helps you make better decisions. Let's see how exactly the candlesticks look and what you should pay attention to.
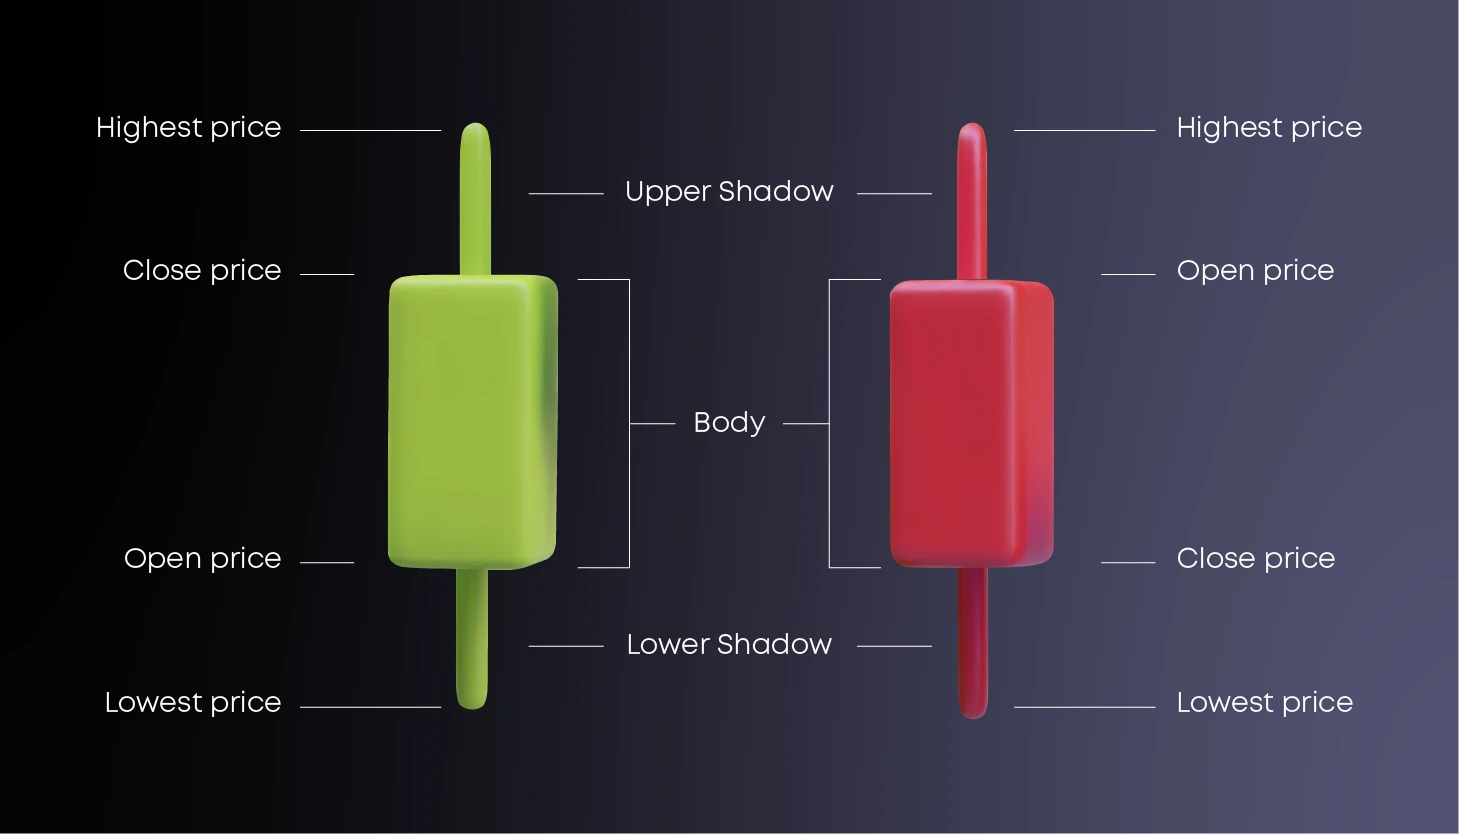
Anatomy of a Candlestick
The body is the rectangular part of the candlestick, showing the difference between the opening and closing prices. If the closing price is higher than the opening price, it’s a bullish candle (usually green or white). If the closing price is lower than the opening, it’s a bearish candle (commonly red or black).
Next, you’ve got the shadows - thin lines sticking out from the body, also called wicks. The upper shadow shows the distance between the top of the body and the high price, while the lower shadow shows the range from the bottom of the body to the low price.
Let’s look at a few key terms to round out your understanding:
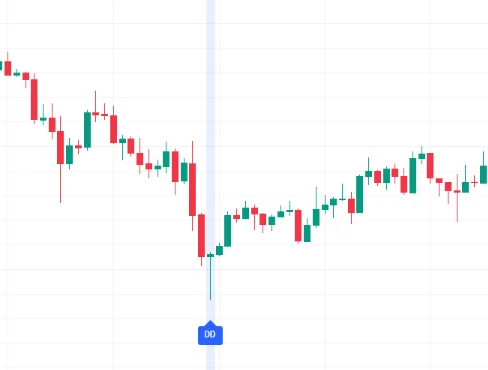
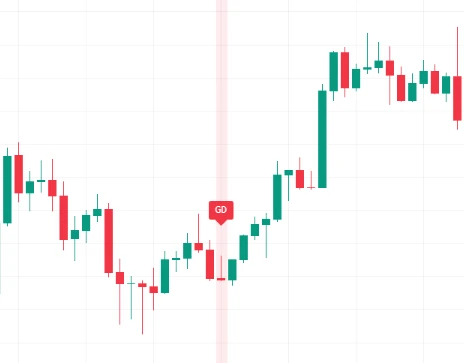
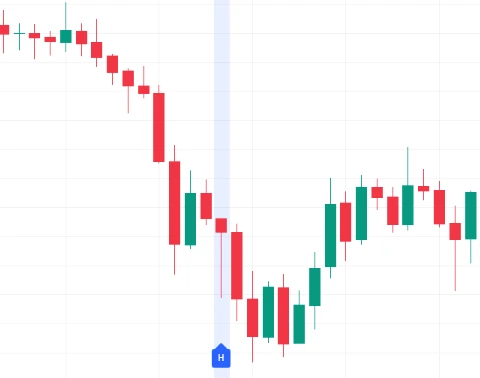
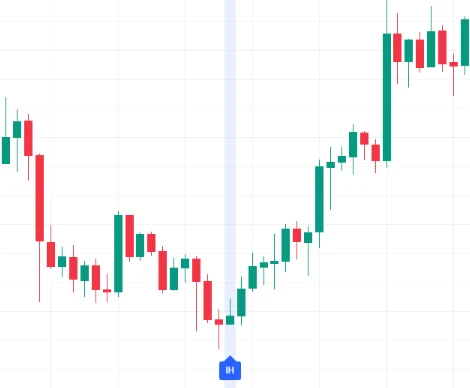
Higher Highs (HH): Each peak is higher than the last, signaling an uptrend.
Lower Lows (LL): Each dip is lower than the one before, pointing to a downtrend.
Higher Lows (HL): Each low gets progressively higher, showing growing bullish momentum.
Lower Highs (LH): Each high gets lower, indicating weakening bullish strength.
For those looking to better visualize these concepts, this video explanation on candlestick patterns provides a detailed overview.
Now, we can move forward and use our visual knowledge to talk about the meaning of candlestick patterns.
Candlestick Patterns and Their Meaning
Two things to remember - there are bullish candlestick patterns that'll help you identify the potential upward trends; and there are bearish candlestick patterns that reveal signs of downward momentum.
First, let's talk about bullish reversal patterns, which point to a potential shift from a downtrend to an uptrend. In simple terms, these patterns highlight possible buying opportunities when the market momentum starts leaning upward.
Then you have bearish reversal patterns, which signal the opposite - a transition from an uptrend to a downtrend. These are your selling cues, warning that prices might soon start falling.
Next, let’s discuss continuation patterns, which tell you the current trend is likely to keep going. Two classic examples here are:
Rising Three Methods
This bullish pattern starts with a long bullish candle, followed by three smaller bearish candles, and ends with another strong bullish candle. It confirms the upward trend will persist.
Falling Three Methods
This bearish pattern works the same way but in reverse. It begins with a long bearish candle, followed by three smaller bullish ones, and wraps up with another bearish candle, signaling the downtrend will continue.
Complementing this knowledge with resources such as crypto patterns can deepen your understanding. Now, after you've learned this, we're going to actually go over every pattern.
Here we give you a catalogue-raisonné of all candlestick patterns. We'll start with simple patterns and then go right to complex ones.
Simple Candlestick Patterns
These are the foundation for understanding more complex formations later on, so it’s important to get these down first.
For each pattern, we’ll break it into two parts: a description, where we explain what the candlestick looks like, and an interpretation, which tells you what the pattern means for market sentiment and potential price movement.
Big Black Candle
Description: A candlestick with a long black (or red) body and minimal shadows. The opening price is near the high, and the closing price is near the low.
Interpretation: This pattern indicates strong bearish sentiment. Sellers dominated the trading session, pushing prices down significantly, signaling potential continued downward momentum.
Big White Candle
Description: A candlestick with a long white (or green) body and minimal shadows. The opening price is near the low, and the closing price is near the high.
Interpretation: This reflects strong bullish sentiment. Buyers were in control throughout the session, driving prices up substantially, often signaling continued upward movement.
Black Body
Description: A candlestick where the closing price is lower than the opening price, forming a filled (black or red) body.
Interpretation: Represents bearish behavior during the trading period. Selling pressure led to a decline in price, often hinting at negative sentiment.
White Body
Description: A candlestick where the closing price is higher than the opening price, forming a hollow (white or green) body.
Interpretation: Signifies bullish behavior during the trading session. Buying pressure caused the price to rise, indicating positive market sentiment.
Doji (Neutral)
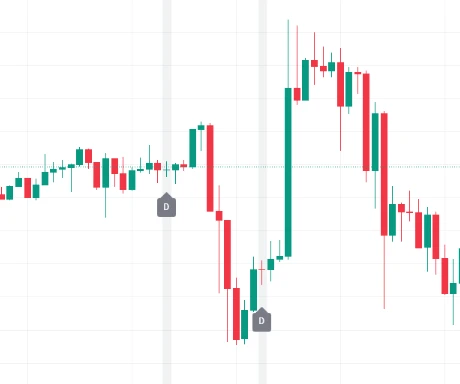
Description: A candlestick where the opening and closing prices are nearly identical, forming a very small or nonexistent body.
Interpretation: The Doji reflects market indecision, as neither buyers nor sellers have taken control. Its significance depends on where it appears:
In an Uptrend: It might signal a reversal to a downtrend.
In a Downtrend: It could suggest a reversal to an uptrend.
In a Sideways Market: It typically shows consolidation without a clear direction.
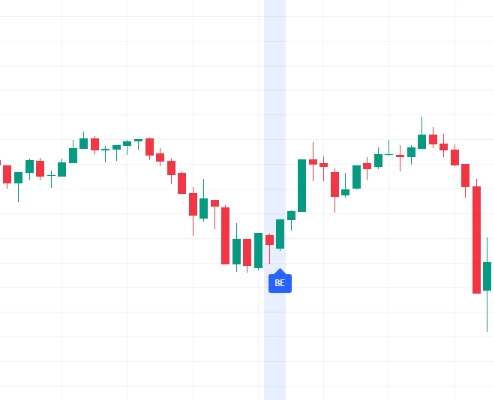
Dragonfly Doji
Description: A Doji with a long lower shadow and little to no upper shadow. The open, high, and close prices are all at or near the same level.
Interpretation: Seen as a bullish reversal pattern, especially after a downtrend. It suggests sellers drove prices down significantly, but buyers stepped in and pushed the price back up to the opening level, signaling renewed buying pressure.
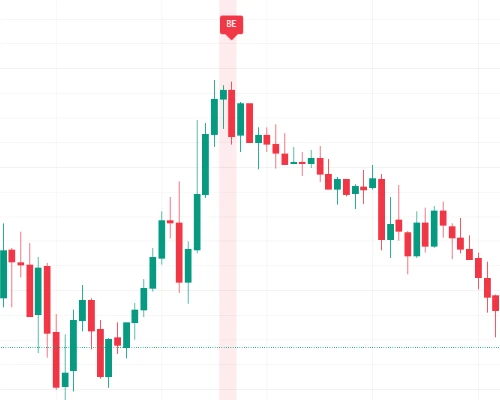
Gravestone Doji
Description: A Doji with a long upper shadow and little to no lower shadow. The open, low, and close prices are all at or near the same level.
Interpretation: Typically signals a bearish reversal when it appears after an uptrend. It shows buyers pushed prices higher, but sellers took control and drove prices back to the opening level, indicating potential selling pressure ahead.
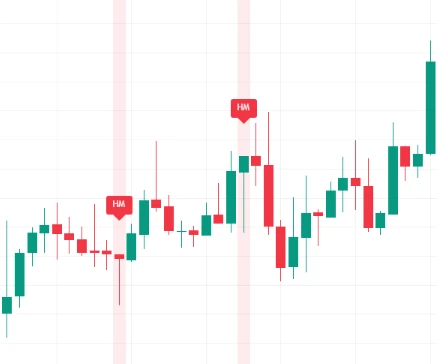
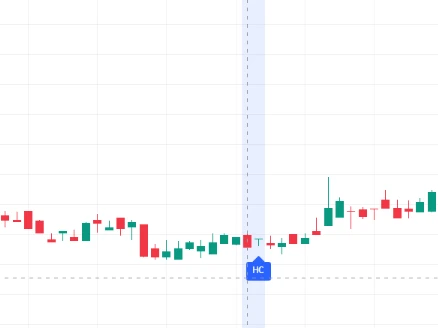
Hammer
Description: A candlestick with a small body, little to no upper shadow, and a long lower shadow at least twice the length of the body.
Interpretation: This is a bullish reversal pattern when it shows up after a downtrend. The long lower shadow signals that sellers drove the price down during the session, but buyers stepped in and pushed it back up. This suggests that downward momentum may be weakening, with a possible upward reversal on the way.
Inverted Hammer
Description: A candlestick with a small body, a long upper shadow, and little to no lower shadow, appearing after a downtrend.
Interpretation: This pattern signals a potential bullish reversal. The long upper shadow reflects buyers’ attempts to push prices higher, even though they faced resistance. The inability of sellers to maintain lower prices hints at a possible upward reversal in the next sessions.
Hanging Man
Description: A candlestick with a small body near the upper end of the trading range and a long lower shadow, typically appearing after an uptrend.
Interpretation: This is a bearish reversal signal. It shows that while prices may have opened and closed near the highs, significant selling pressure emerged during the session. This increase in selling could be a warning that the uptrend is losing strength.
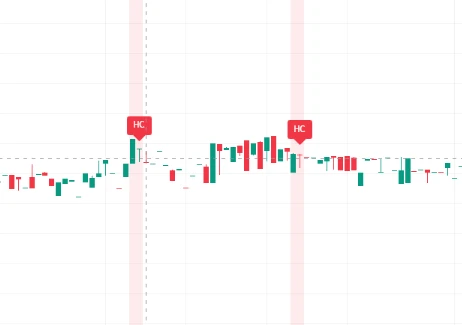
Shooting Star
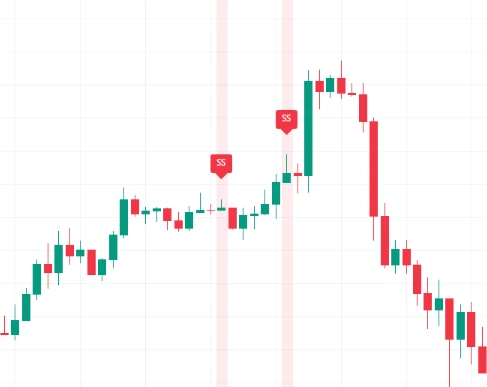
Description: A candlestick with a small body near the low of the session, a long upper shadow, and little to no lower shadow, forming after an uptrend.
Interpretation: This pattern suggests a bearish reversal. Buyers initially pushed prices higher, but sellers regained control, driving the price back near the opening level by the session’s close. This shift in control often signals weakening bullish momentum and a potential trend reversal.
Long Lower Shadow
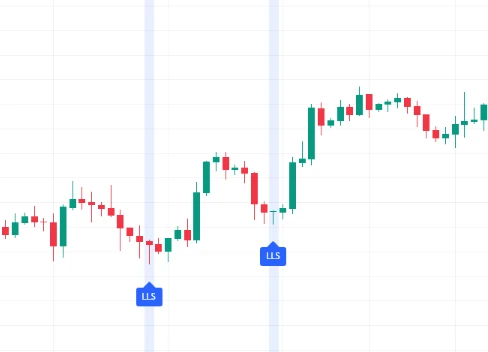
Description: A candlestick with a long lower shadow that makes up at least two-thirds of the candlestick's range, with a small real body near the high.
Interpretation: This pattern suggests potential bullishness. The long lower shadow indicates that lower prices were tested but ultimately rejected, showing strong buying interest during the session.
Marubozu
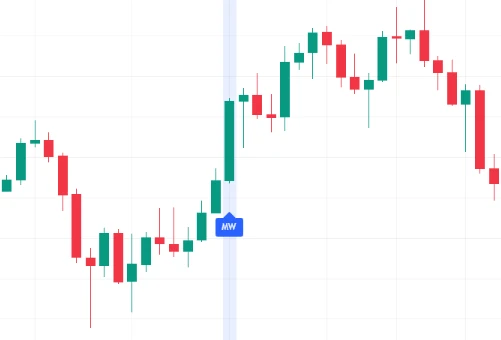
Description: A candlestick with no shadows; the open and close align with the high and low of the session.
Interpretation: This is a strong signal of continuation in the trend’s direction. A bullish Marubozu in an uptrend signals aggressive buying, while a bearish Marubozu in a downtrend reflects strong selling pressure.
Spinning Top
Description: A candlestick with a small real body and long upper and lower shadows.
Interpretation: This pattern reflects indecision in the market. Buyers and sellers both pushed prices significantly during the session, but neither side gained control. It often leads to a neutral outlook until further confirmation from the next candlesticks.
Shaven Head
Description: A candlestick with no upper shadow, where the open or close is at the session’s high.
Interpretation: In a bearish context, this pattern highlights strong selling pressure, as prices dropped to their lowest point without any upward retracement by the close.
Shaven Bottom
Description: A candlestick with no lower shadow, where the open or close is at the session’s low.
Interpretation: In a bullish context, this pattern reflects strong buying pressure, with prices rising to their highest point and holding there until the close.
Complex Candlestick Patterns
Let’s move on to complex candlestick patterns. This involves deeper insights into market trends and potential reversals, so be attentive.
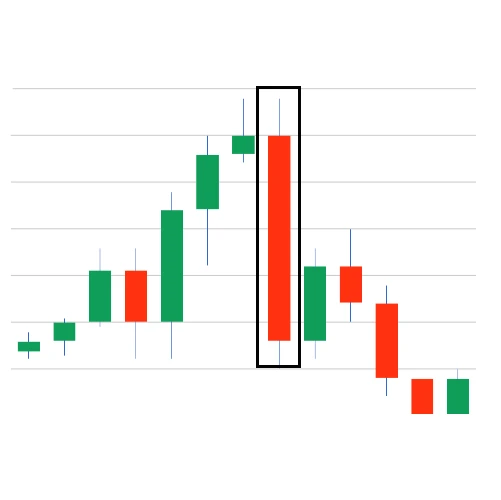
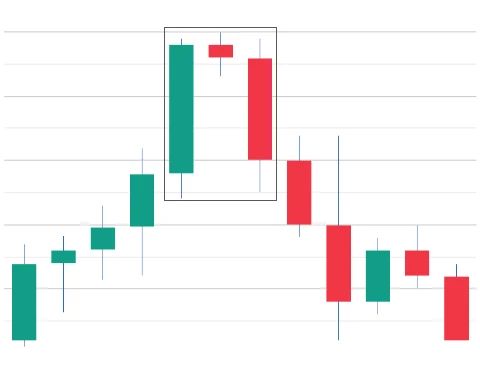
Bearish Harami
Description: A two-candle pattern that appears during an uptrend. The first candle is a large bullish (white or green) candlestick, followed by a smaller bearish (black or red) candlestick that is fully contained within the body of the first candle.
Interpretation: This pattern signals a potential bearish reversal. It indicates that the prior uptrend may be losing momentum, as selling pressure starts to build.
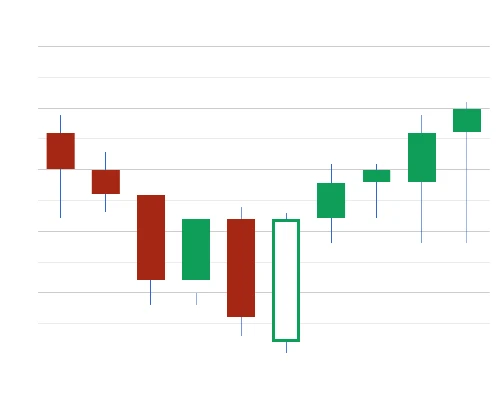
Bullish Harami
Description: A two-candle pattern that occurs during a downtrend. It begins with a large bearish candlestick, followed by a smaller bullish candlestick that is entirely within the body of the first candle.
Interpretation: This pattern suggests a potential bullish reversal. It reflects weakening selling pressure and hints that the preceding downtrend may be coming to an end.
Bearish Harami Cross
Description: Similar to the Bearish Harami, but the second candle is a Doji—a candlestick with nearly equal open and close prices—indicating indecision in the market.
Interpretation: This is considered a stronger bearish reversal signal than the standard Bearish Harami. The presence of the Doji emphasizes market indecision, suggesting that bullish momentum is fading and a shift to bearish sentiment may be underway.
Bullish Harami Cross
Description: Similar to the Bullish Harami, but the second candle is a Doji, where the opening and closing prices are nearly equal.
Interpretation: This pattern is a stronger bullish reversal signal than the standard Bullish Harami. The Doji emphasizes market indecision, suggesting that bearish momentum is weakening and buyers may soon take control.
Engulfing Bearish
Description: A two-candle pattern where a small bullish (white or green) candle is followed by a larger bearish (black or red) candle that completely engulfs the body of the first candle.
Interpretation: This pattern indicates a potential bearish reversal. It signals that sellers have taken control after an uptrend, often foreshadowing further downward movement.
Engulfing Bullish
Description: A two-candle pattern where a small bearish candle is followed by a larger bullish candle that fully engulfs the body of the previous candle.
Interpretation: This pattern suggests a potential bullish reversal. It highlights that buyers have regained strength after a downtrend, signaling the possibility of upward momentum.
Bearish 3-Method Formation (Falling Three Methods)
Description: A five-candle pattern that begins with a long bearish candle, followed by three smaller bullish candles that stay within the range of the first candle, and concludes with another long bearish candle.
Interpretation: This pattern indicates a continuation of the bearish trend. The smaller bullish candles show temporary buying pressure, but their inability to break out of the initial range confirms that the downtrend is likely to persist.
Evening Star
Description: A three-candle pattern starting with a long bullish candle, followed by a small-bodied candle that gaps above the first, and ending with a long bearish candle that closes well into the body of the first candle.
Interpretation: This pattern signals a potential bearish reversal, suggesting that the uptrend may be losing steam and a downtrend could be on the horizon.
Evening Doji Star
Description: Similar to the Evening Star, but the middle candle is a Doji, indicating indecision in the market.
Interpretation: This is seen as a stronger bearish reversal signal compared to the standard Evening Star. The Doji reflects greater uncertainty before sellers take control, making the signal more reliable.
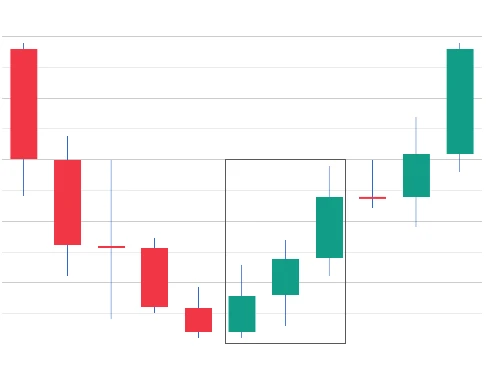
Morning Star
Description: A three-candle pattern beginning with a long bearish candle, followed by a small-bodied candle that gaps below the first, and concluding with a long bullish candle that closes well into the body of the first candle.
Interpretation: This pattern suggests a potential bullish reversal, indicating that the downtrend may be nearing its end and buyers are gaining momentum.
Morning Doji Star
Description: A three-candle bullish reversal pattern that appears after a downtrend. It starts with a long bearish candle, followed by a Doji that gaps below the previous candle, and ends with a bullish candle that closes well into the body of the first candle.
Interpretation: This pattern signals a potential bullish reversal, showing that selling pressure has faded and buyers are beginning to take control of the market.
Falling Window
Description: A bearish continuation pattern where there is a gap between two candles. The high of the second candle remains below the low of the first candle.
Interpretation: This pattern suggests that the downtrend will continue, with the gap acting as a resistance level. Sellers are firmly in control, and further price declines are likely.
Rising Window
Description: A bullish continuation pattern featuring a gap between two candles, where the low of the second candle stays above the high of the first candle.
Interpretation: This pattern indicates that the uptrend is likely to persist, with the gap acting as a support level. Buyers remain dominant, pushing prices higher.
Three Black Crows
Description: A bearish reversal pattern consisting of three consecutive long bearish candles, each closing lower than the previous candle, with little to no shadows.
Interpretation: This pattern signals strong selling pressure and a potential reversal from an uptrend to a downtrend. It reflects sustained bearish momentum over multiple sessions.
Three White Soldiers
Description: A bullish reversal pattern made up of three consecutive long bullish candles, each closing higher than the previous candle, with minimal shadows.
Interpretation: This pattern suggests strong buying pressure and a potential reversal from a downtrend to an uptrend. It indicates consistent bullish momentum over several sessions.
On Neckline
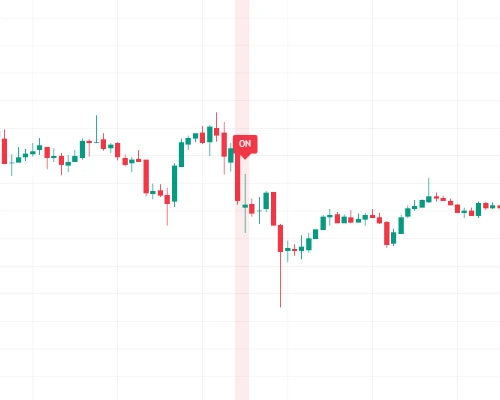
Description: A bearish continuation pattern appearing during a downtrend. It starts with a long bearish candle, followed by a smaller bullish candle that closes near the low of the preceding bearish candle.
Interpretation: This pattern signals that the downtrend is likely to continue, particularly if the low of the bullish candle is breached. The smaller bullish candle shows weak buying pressure, hinting at further declines.
Doji Star
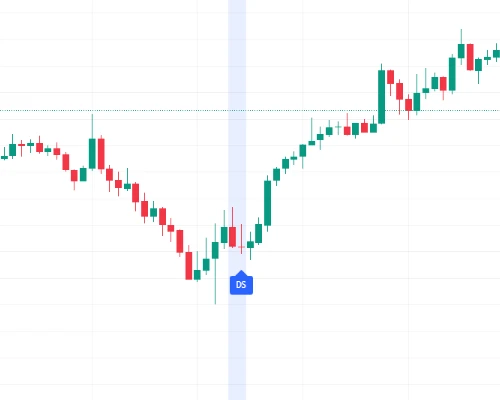
Description: A two-candle pattern where a long candle is followed by a Doji that gaps above or below the previous candle. This setup reflects indecision in the market.
Interpretation: This pattern acts as a potential reversal signal. However, confirmation from the next candle is essential to determine whether a trend change is underway.
Tweezer Tops
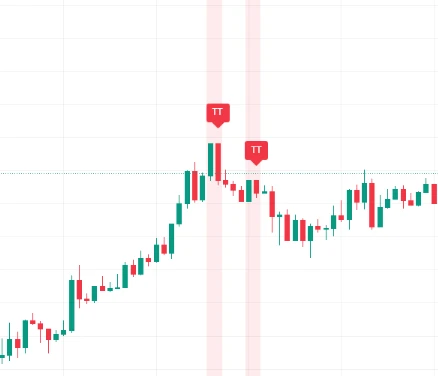
Description: A bearish reversal pattern where two or more candles have matching highs, typically forming after an uptrend.
Interpretation: This pattern suggests that the uptrend may be losing momentum. It often signals that a reversal to the downside is on the horizon as buying pressure weakens.
Tweezer Bottoms
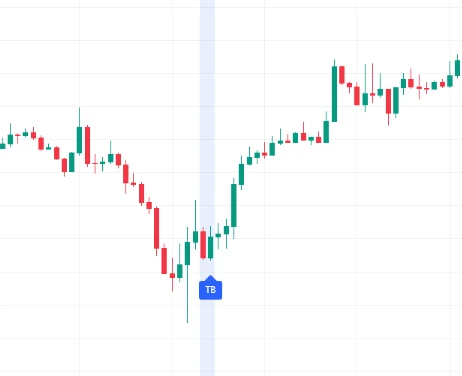
Description: A bullish reversal pattern occurring after a downtrend, characterized by two consecutive candles with nearly identical lows.
Interpretation: This pattern signals that selling pressure may be diminishing. It often indicates a potential shift to an upward trend as buyers start to gain strength.
Dark Cloud Cover
Description: A bearish reversal pattern with a bullish candle followed by a bearish candle that opens above the previous high but closes below the midpoint of the prior candle.
Interpretation: This pattern shows a transition from buying to selling pressure. It suggests that bearish sentiment is growing, increasing the likelihood of a downward trend.
Piercing Line
Description: A bullish reversal pattern forming after a downtrend. A bearish candle is followed by a bullish candle that opens lower but closes above the midpoint of the previous candle.
Interpretation: This pattern indicates a potential shift from selling to buying pressure, signaling a possible upward trend as buyers start to take control.
Darth Maul
Description: A candlestick with long upper and lower shadows and a small real body, resembling extreme price swings or a "whipsaw" in both directions.
Interpretation: This pattern reflects significant market volatility and indecision. It often results in unpredictable price movements, requiring traders to approach with caution.
Judas Candle
Description: A candlestick that initially moves in one direction, triggering trades or stop-loss orders, before reversing sharply. This traps traders in false positions.
Interpretation: This pattern highlights potential market manipulation or sudden reversals. It serves as a warning for traders to be cautious of false breakouts and erratic price movements.
Island Reversal
Description: A reversal pattern where a group of price bars is isolated from preceding and succeeding price action by gaps, creating an "island" on the chart.
Interpretation: This pattern signals a strong reversal of the current trend. The gaps on either side of the island indicate a significant shift in market sentiment, often marking the start of a new trend direction.
Mat Hold
Description: A bullish continuation pattern that begins with a strong bullish candle, followed by a series of smaller candles that may slightly retrace, and ends with another strong bullish candle.
Interpretation: This pattern suggests a brief pause in the uptrend as prices consolidate, followed by a continuation of the upward movement. It reflects sustained buying interest and confidence in the prevailing trend.
We’ve finally reached the end!
This was a long ride, but now you’ve got a solid understanding of candlestick patterns, from the simplest ones to the more complex formations. You know what they look like, what they mean, and how to interpret them in real market scenarios.
If you consider using that knowledge in crypto, make sure to do alongside the article on which crypto to buy today for short-term.
So, take a breather, review what you’ve learned, and when you’re ready, go into the markets with your newfound knowledge.
FAQ
What’s included in the candlestick patterns PDF/cheat sheet?
The candlestick patterns PDF/cheat sheet includes the anatomy of a candlestick, key trading terms, common bullish and bearish patterns, advanced reversal and continuation patterns, and practical trading tips.
How to read candlestick patterns?
To read candlestick patterns, check the body, wicks, and colors: green/white for bullish, red/black for bearish.
How to trade with candlestick patterns?
To trade, identify patterns and confirm with market trends and indicators.
Does candlestick pattern analysis really work?
It works well with other tools but isn’t foolproof alone.
Which candlestick pattern is most reliable?
The most reliable patterns are "Three White Soldiers" and "Three Black Crows."
What is the 3-candle rule?
The 3-candle rule uses three candles to signal reversals or continuations.
What is a candlestick pattern cheat sheet?
A cheat sheet is a quick guide to candlestick patterns with visuals.
What are the best candlestick patterns for beginners?
The best patterns for beginners are Hammer, Shooting Star, and Engulfing patterns.
What are the best candlestick patterns to look for?
The best patterns to look for are Morning Star, Evening Star, and Three White Soldiers.
What are price action candlestick patterns?
Price action patterns include Doji, Pin Bar, and Inside Bar.
What are the best candlestick patterns for day trading?
The best patterns for day trading are Doji, Spinning Top, and Marubozu.
What are the best candlestick patterns for scalping?
The best patterns for scalping are Engulfing, Morning Star, and Doji.
What are the best candlestick patterns for entry?
The best patterns for entry are Hammer, Shooting Star, and Engulfing patterns.